An overview and dive into the features and calculations of the Variance Tab.
Features accessible to all users with report access.
Overview
The Variance Tab displays key figures regard variances at a Class, Category, and Brand level, as well as loss leaders and trends by classifications. These figures displayed are specific to the venue listed in the header, based on the chosen timeframe.
Table of Contents:
Loss at Cost

The loss at Cost figure represents the purchase or wholesale value of the missing product and how much it would cost to replace it. Sculpture Hospitality is able to add up all the missing ounces of inventory by their individual costs per ounce.
PRO TIP!
Positive Losses - If your report displays a positive figure, this means your usage is less than your sales quantities resulting in an unexplained gain in on-hand inventory. This could be from numerous under-pours, a misconfigured recipe, or something else.
Revenue Potential
Revenue Potential represents the value of the additional monies a venue would have earned if every loss or shortage had been sold to a consumer.

YTD Loss at Cost

The Year-to-Date Loss at Cost figure represents the summation of the wholesale value of the missing product and how much it would cost to replace it, over the entire year.
Need more clarification on Loss at Cost?
YTD Revenue Potential
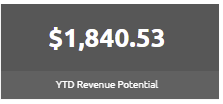
The Year-to-Date Revenue Potential figure represents the summation of the value of the additional monies a venue would have earned if every loss or shortage had been sold to a consumer, over the year.
Sales vs. Revenue Variance

This pie chart style breakdown represents a comparison of the sales data, imported
from the venue's point-of-sale system and the overall percentage (%) of lost revenue at retail value during the timeframe identified in the header at the top of the page.
This figure is beneficial when non-brand specific modifiers exist in a client's point-of-sales setup; such as Rocks, Martini, etc.,
A suggested Revenue Variance target range from 1.5% to 3%.
Retail Variances
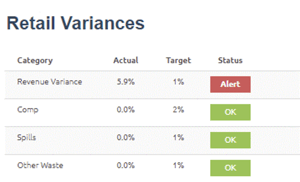
The retail variances listed in this table visualization display a measured variance vs. a pre-set target variance percentage % as a performance alert.
Displayed are the overall retail revenue variance, and various price levels defined in your venue's setup.
The system will alert you with a status of "ALERT" when your variance falls outside of this threshold.
Want to change your target percentage? Speak to your current Sculpture Hospitality representative or find your local rep today!
Class Variances
This table visualization displays the status of all variances at a product classification level.
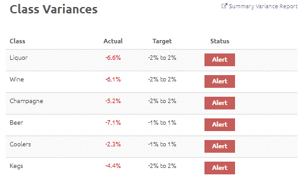
The variance is the difference in the measured usage and sales quantities, represented as a percentage (%), for all products by class.
With preconfigured target ranges of -2% (lower) and 2% (upper), the system will alert you with a status of "ALERT" when your variance falls outside of this threshold.
This table also includes a drill-down feature to the summary variance report to dig deeper into these variances.
Want to change your variance threshold? Speak to your current Sculpture Hospitality representative or find your local rep today!
Loss Leaders
This bar chart and table combination visual displays a list, ranked from 1 to 10, based on the missing product cost, ranked highest to lowest. To see a complete list of all products you can drill down further by selecting the detailed variance report button in the top right of the table.

Variance Trend
The Variance Trend table displays the variances of each product classification over a timeframe of up to 15 periods or roughly 1 quarter. A variance is a measure of performance, either up or down, against a perfect result, generally measured as a percentage (%) or dollar figure. 
PRO TIP!
Significant swings in variances should be explored within each period to identify the cause. If you are missing or have lost stock you will show a negative variance. Your Sculpture representative can help you identify the cause!