An overview and dive into the features and calculations of the Purchases Tab.
Features accessible to all users with report access.
Overview
The Purchases Tab displays key figures specific to all purchased products for the client displayed in the header, based on the chosen timeframe. These figures include historical purchases, top 10 purchase lists, purchases broken down by classification and vendor, as well as a product cost fluctuation report.
Table of Contents:
Previous Period Purchase
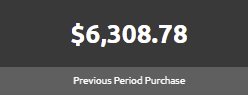
The Previous Period Purchase figure represents the total value of the product purchased, from all vendors, in the previous inventory period.
Current Period Purchase
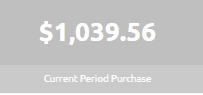
The Current Period Purchases figure represents the total value of the product purchased, from all vendors, in the current inventory period.
Suggested Purchase
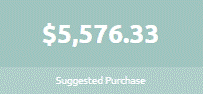
The Suggested Purchase figure represents the total value of the product, from all vendors, that has been recommended to be purchase by the Sculpture Hospitality iPAR System.
This intelligent PAR system uses historical usage and purchase data, as well as configured rules down to the product brand level to make these suggestions.
Purchase Variance
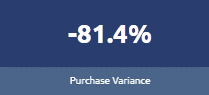
The Purchase Variance figure, presented as a percentage (%), represents the difference between the suggested purchases and the current period's purchases.
Historical Purchases
This historical timeline displays the total value of purchases from all vendors over a timeframe of up to 15 periods or roughly 1 quarter.
 This chart contains a tooltip feature, allowing a user to hover over and see the Sculpture Rating at each plotted point.
PRO TIP!
Understanding your historical purchase trends can help you better manage your future purchase and stock on-hand through either the Sculpture Hospitality iPAR system.
Top 10 Purchased Products
The Top 10 Purchase Product table visualization displays products and brands, ranked from 1 to 10, based on the highest value of the total purchased value to the lowest.
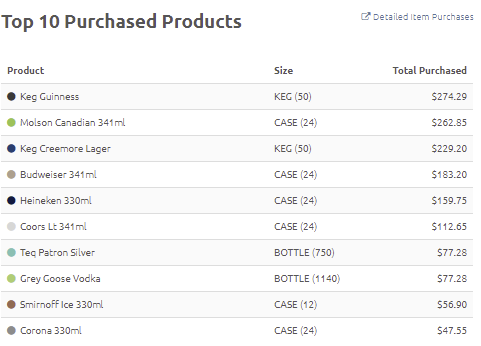
In addition, a drill-down feature is located in the top right corner, which will navigate to the detailed item purchase report.
Purchases by Class
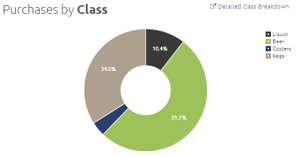
This pie chart style breakdown represents the total monetary value, represented as a percentage (%), of all purchased stock during the timeframe identified in the header at the top of the page.
This chart groups brands together by Classification and each slice of the pie chart has a hover tooltip feature that will provide more details.
In addition, a drill-down feature is located in the top right corner, which will navigate to the detailed class breakdown report.
Purchases by Vendor
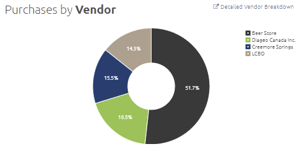
This pie chart style breakdown represents the total monetary value, represented as a percentage (%), of all purchases by Vendor during the timeframe identified in the header at the top of the page.
This chart groups brands together by Vendor and each slice of the pie chart has a hover tooltip feature that will provide more details.
In addition, a drill-down feature is located in the top right corner, which will navigate to the detailed vendor breakdown report.
Product Cost Fluctuation
The Product Cost Fluctuation table displays a breakdown of specific products whose prices have changed in some capacity from one period to the next, or over larger periods of time.
 Where do these figures come from?
-
- Size : The product's specific purchased unit of measure.
- Cost : The price paid for the most recent purchase of the product and size.
- Date : The date of the invoice of the most recent purchase of the product and size
- Vendor : The vendor that the product was most recently purchased from.
- Prev. Cost : The product's previous purchase amount, which is being compared to the current cost.
- Prev. Date : The date of the invoice for a product of a previous purchase that was different in price from the most recent.
- Prev. Vendor : The vendor that the previously purchased product was purchased from at a higher or lower price than currently.
- Difference : The monetary value difference between the current cost and the previous cost.
- % Difference : The monetary value difference, represented as a percentage (%) between the current cost and the previous cost.